
Satellite Capacity Forecasts: How Well Did They Hold Up?
We compared a handful of satellite capacity forecasts with later published estimates. Several ran low, and the supply gap is expected to narrow.
Analyst forecasts for satellite capacity always seem a bit optimistic in the moment. We compared a handful of publicly traceable forecasts with later published estimates. Several ran low, the largest by about three times: a 2013 forecast put demand at nearly 1 Tbps by 20221, and it reached about 32. The chart shows them all.
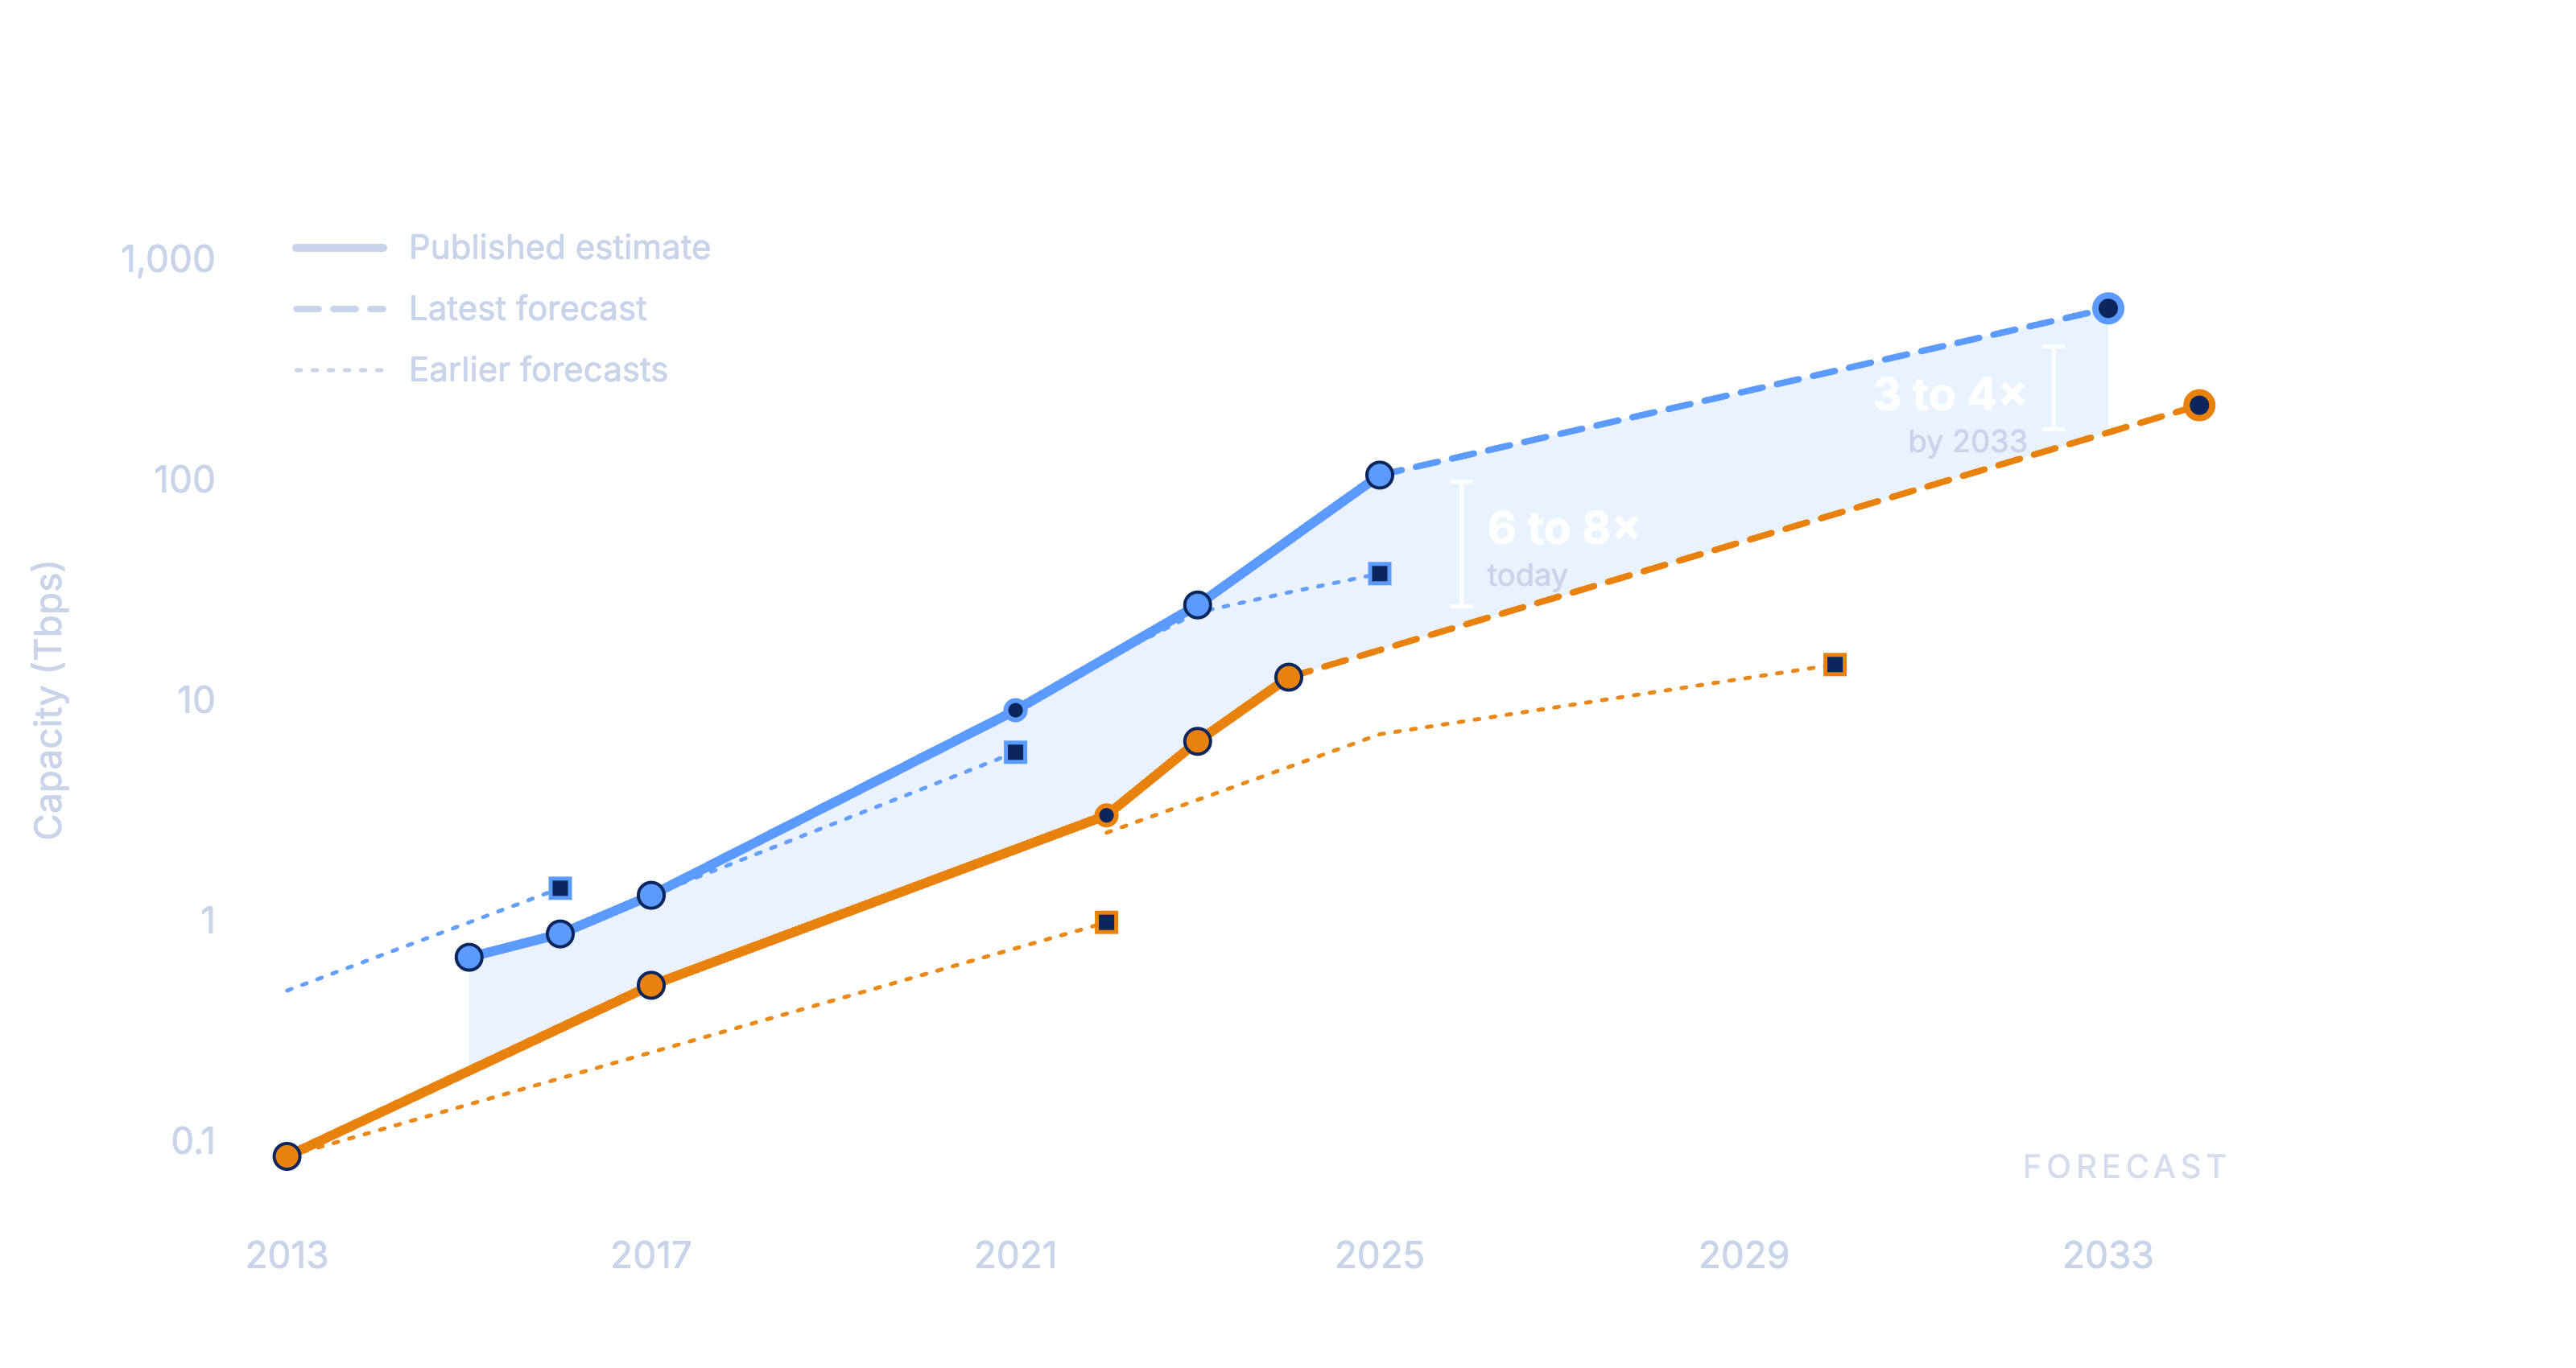
Solid lines are published estimates.34 Dotted lines are earlier forecasts, made in 2013, 2018 and 2022, in the colour of the series they predict. Dashed lines are the latest forecasts. Hollow circles are values implied by a published growth multiple.
The largest misses were on the low side and a few years out, and the reason is low Earth orbit. Analysts saw it coming: the 2018 forecast allowed for more than 11 Tbps by 2024 if the constellations launched5. What they underestimated was the scale and speed. Supply went from 27 Tbps in 20232 to 105 Tbps in 20256, leaving 6 to 8 Tbps of supply for every 1 Tbps of demand, up from about 4 in 2023 and under 3 in 20175.
From here the gap is expected to narrow, though this is the least certain part. Demand is forecast at 218 Tbps by 20347 against more than 600 Tbps of supply by 20338, a ratio of 3 to 4, but those figures come from different firms and target years. Demand forecasts are also still moving: one 2034 outlook was 141 Tbps9, and another from the same firm four months later was 218 Tbps7, possibly on a different scope. The 2022 demand forecast of 14.5 Tbps for 203010 already looks low, with 12.7 Tbps reached by 20249.
This is not a complete sample, and definitions vary between sources. Read it for direction and rough size, not as a measured forecast error.
Sources
-
Euroconsult, November 2013: HTS demand of about 85 Gbps in 2013, nearly 980 Gbps forecast for 2022, and HTS supply of 1,400 Gbps forecast for 2016. ↩
-
Novaspace, April 2024: HTS supply tripled between 2021 and 2023 to 27 Tbps, HTS demand doubled in 2023 to 6 Tbps. ↩ ↩2
-
Euroconsult, March 2016: HTS supply of 680 Gbps in 2015. ↩
-
Novaspace, September 2024: capacity demand across all orbits of 6.5 Tbps in 2023. ↩
-
Nathan de Ruiter, Euroconsult, in APSCC Quarterly, 2018 issue 4: supply of 868 Gbps in 2016 and close to 1.3 Tbps in 2017, 5.8 Tbps forecast for 2021, leased capacity of about 508 Gbps in 2017, and capacity that could exceed 11 Tbps in 2024 with LEO constellations. ↩ ↩2
-
Novaspace, October 2025: total supply up 3.5 times between 2023 and 2025 to 105 Tbps. ↩
-
Novaspace, March 2026: global HTS demand of 218 Tbps by 2034. ↩ ↩2
-
Analysys Mason, space practice page: more than 600 Tbps of combined GEO and LEO/MEO supply by 2033. The page does not date the forecast. ↩
-
Dimitri Buchs, Novaspace, in Kratos Constellations, November 2025: demand growing from 12.7 Tbps to 141 Tbps in 2034. The accompanying infographic dates the 12.7 Tbps figure to 2024. ↩ ↩2
-
UK Competition and Markets Authority, Viasat/Inmarsat final report, May 2023, paragraphs 2.15 and 2.18: Euroconsult forecast of HTS demand from about 2.5 Tbps in 2022 to more than 7 Tbps in 2025 and about 14.5 Tbps in 2030, and of HTS supply of 25.0 Tbps in 2023 and 37.5 Tbps in 2025. ↩